Since I upgraded my Windows 7 developer box with Internet Explorer 11 I am very satisfied with how Microsoft upgraded developer tools. They have added new stuff and it works (well from time to time IE freezes but that might be also my problem with my JavaScript since other browsers hang/crash from time to time on my code also). But that is another story.
Today I came across small “feature” that took me few minutes to realize, what is happening.
I am using IE 11 to debug older ASP.NET WebForms app (with older I mean we are just now moving away from HTC files – Microsoft specific stuff).
IE is loading page from my local IIS with x-ua-compatible flag like described on the link provided, setting rendering core to use version 8 so behaving like IE8.
Loading my page like this results to loading just some .htc files referenced. If I set breakpoint to some code in .htc file, it will be not hit, even some objects are declared as undefined but strangely executing any method over these yields results and works as expected (so I suppose the JS core works as it should , it’s just matter of developer tools).
Quick fix to this is : just reload the page, then all files will be loaded and you can happily work as expected.
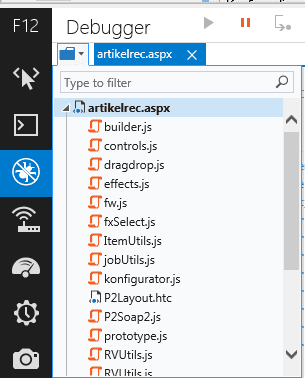
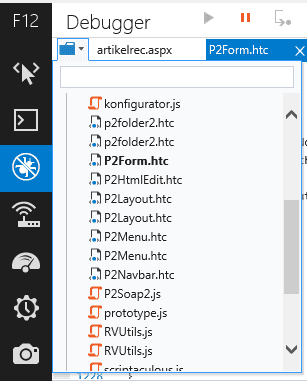
Small sample how it looks like in IE developer tools (the very same page, just loaded 2 times) :
First load:
Second load:
Just in the case, version of my IE 11 :
Hope this helps.


