I just came across nice thing with Internet Explorer 10 on Windows 7.
I was debugging JS on my dev box and I experienced problem like this :

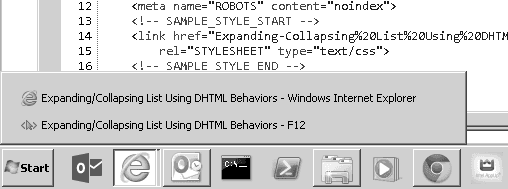
At first it seems like development tools freezed. Also IE as such freezed. What I saw was IE with page in the back and tools with note you see above. I clicked on IE icon in taskbar and saw two “windows” like this.
In fact what happened and I didn’t realized that was :
- I started IE,
- I opened development tools – tools are attaching to IE and listening to events = we are debugging,
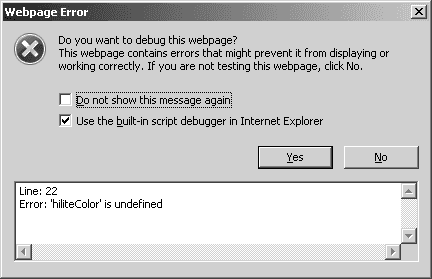
- some JS error happened,
- I clicked on “Do you want to debug this web page?”,
IE opened another development tools and now we have 2 development tools windows opened like this :
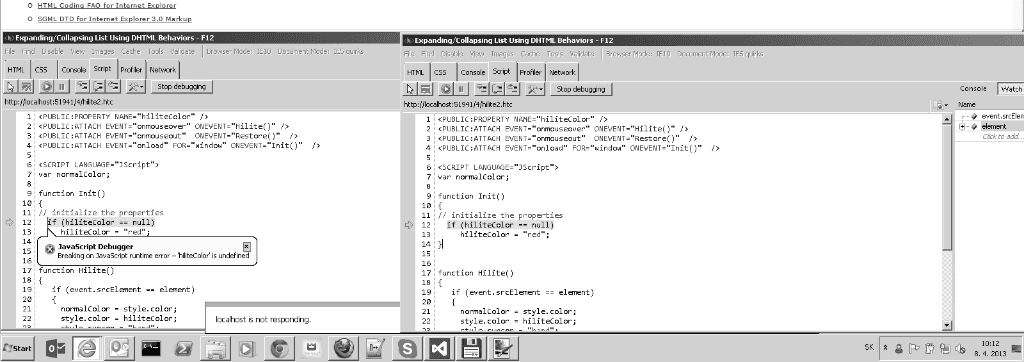
Problem is, that you see only 2 windows opened under IE icon, the reality is that you have IE and 2 development tools windows. 1 is live and working, 2 is blocked by newly opened one and might be hidden behind one of these two. So beware of this fact. IE works well, but this behaviour is not expected, at least by me.
Hopefully this will save you some time. Enjoy.
AD: I found one more thing. If IE while debugging misbehaves and shows you blablabla page is not responding – same as in first picture – just hit Win key + D = shortcut to display desktop and bring IE up again and it should work 🙂
Hope this helps.